Dredging the watermaze
Extracting detailed information from the data gathered during watermaze studies of learning and memory in mice.
Working draft of manuscript
Abstract
Learning and memory in mice are commonly tested using the Morris water maze. Mice are released from the edge of the pool and allowed to swim for 60 s in search of a submerged platform. Since mice do not like water, they are assumed to prefer being on the platform. This process is repeated 32 times in the space of four days, with the start point pseudo-randomly alternating between four points around the edge of the pool. As the trials progress, it is assumed that the mice learn the position of the platform, and therefore choose a more direct swimming route. Thus the rate of improvement in the time required to find the platform (platform latency to first entry) is taken as a measure of learning ability.
In this study I have taken the raw positional data from 120 mice (C57BL/6 background) with seven different genotypes and examined the paths swum by each mouse for signs of learning. The raw data shows behaviour which is a great deal more complex than standard analysis suggests. It is in fact extremely rare for a mouse to swim directly to the platform even after it has successfully performed many trials. A detailed discussion of what can be determined by these methods is presented below, but there are two novel conclusions which can be drawn.
First, the swimming behaviour shows strong traits of anxiety, and a genotype-dependent adaptation to this anxiety over time. Anxiety in the watermaze correlates reasonably with results from the open field test and tends to be negatively correlated with the average platform latency to first entry. This challenges the validity of defining learning by the time required to find the platform, since this measures an interaction between anxiety and learning. Without controlling accurately for anxiety in the Morris water maze it is very likely that what is being measured is at least as much the genotype's rate of adaptation to anxiety, rather than meaningful learning.
Second, and more interestingly, I observe a striking tendency in the memory retention testing data taken on days 5 and 12. These two trials start from a previously unused point and the latency to platform is measured. Again the anxiety problem exists, so increased latencies a week later may only be measuring a higher rate of anxiety de-acclimatization, rather than forgetfulness. Irrespective of this, however, there is often a surprising similarity between the two paths swum by any one mouse, with a seven day interval between trials. While most ecology studies of animal navigation show relatively simple and qualitatively similar paths through complex landscapes, a mouse swimming in a circular pool follows a relatively complex path in the simplest possible landscape. Rather than triangulating on the visual cues and using them to navigate to the platform, it appears that many of the mice attempt to follow the path they swam a week earlier, even if it is an extremely inefficient route to the platform. While this would be easy to perform in a complex landscape with physical barriers and many visual cues, swimming a repeat of a complex path one week later seems like a much harder navigational task (in human terms) than any other approach. This suggests that a mouse's spatial memory differs from human spatial memory and may be more dynamically visual, perhaps allowing the mouse to retrace its tracks in space as though it were constantly able to compare its position with a video record of its previous path. We can also speculate as to whether this behaviour is a stress-related strategy, whereby a known path to safety (they are conditioned to expect rescue after a maximum of 60 s) is chosen automatically in a panic, in preference to any rational attempt to navigate.
1: Introduction
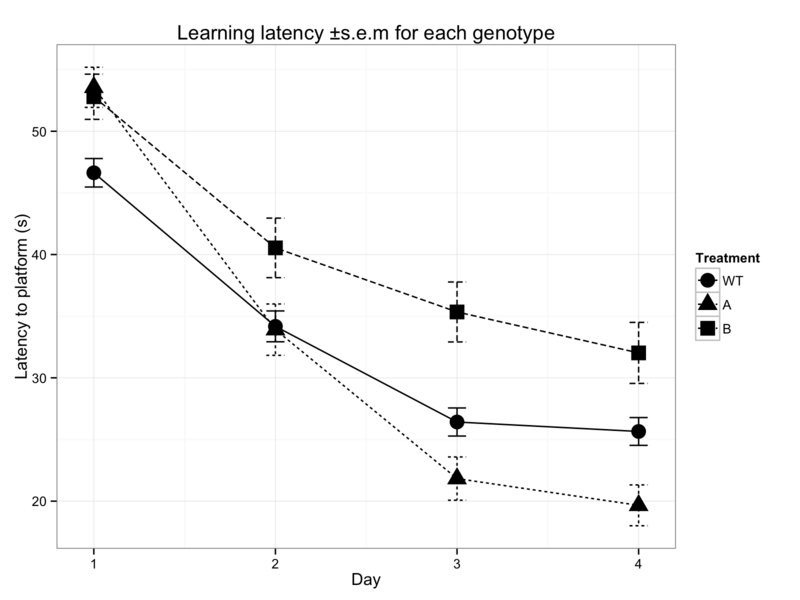
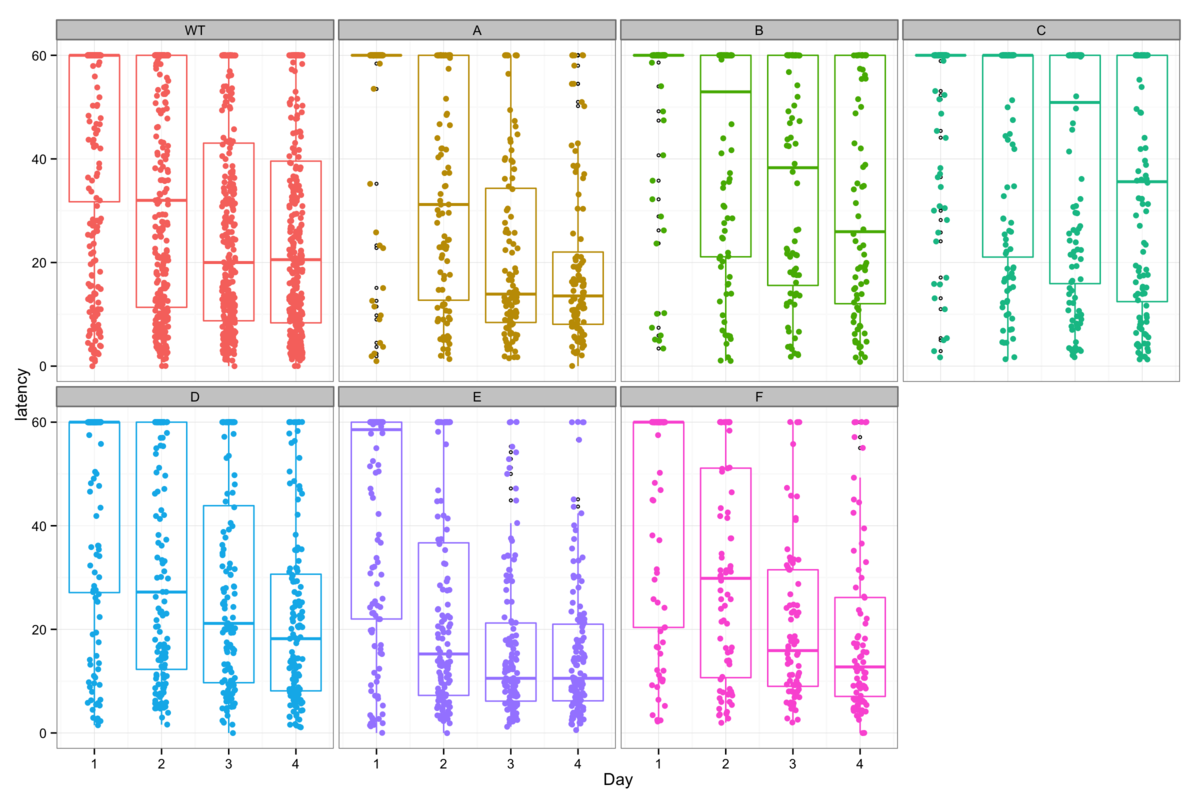
Figure 1: Learning in the Morris water maze is measured as a progressive decrease in the time required for mice to swim to a hidden platform and is typically presented as shown in 1A (left). This is a great oversimplification of the raw data shown in 1B (right) and often incorrectly handles right-censored data.
The Morris water maze is commonly (5258 hits on PubMed on 13.05.2014) used to measure learning and memory in mice. Over a period of 4 days, mice are released according to the protocol shown below and the time required to swim to the submerged platform (platform latency to first entry) is recorded. The layout of the maze with start points is shown below.
There are varying standards for the analysis of these data as discussed in more detail below, but this is not the primary focus of this study, although I cover it in some detail later. The fact remains that the entire exploration and learning process undergone by any one mouse, over four consecutive days, is reduced from a detailed positional dataset with sub 0.125s time resolution, to 32 data points.
The main motivation for this study was to use all of the available detail in the experimental data to refine and confirm the behavioural conclusions we draw. Therefore we extracted all of the raw tracking data from the Any-Maze data files for 120 mice with 7 different genotypes, to discover how these data relate to the simple latency measure.
The following relations have been investigated. The dependence of swimming speed upon position (proximity to the wall of the maze), time (do they swim constantly or intermittently) and genotype. How starting position affects the rate of successful platform discovery. How individuals develop a strategy to find the platform. How navigational strategies relate to success or failure of the platform search. How paths can be parameterized to determine differing strategies.
The following points should be taken into consideration when analysing watermaze data.
- Mice do not like swimming, therefore it is reasonable to expect that they want to escape from the watermaze.
- If they want to escape, they are likely stressed, which means that they are probably learning whilst anxious.
- The association of latency with learning is presumably based upon the rational assumption that mice want to minimize the time spent swimming and that they will therefore choose the shortest path to the platform. We should consider the possibility that sufficiently anxious mice respond purely instinctively, rather than rationally.
- While most ecology studies of animal navigation show relatively simple and qualitatively similar paths through complex landscapes, a mouse swimming in a circular pool follows a relatively complex path in the simplest possible landscape.
The MWM (Vorhees and Williams, 2006) task was performed in a randomized order when the mice were 6 months of age. The trials were carried out in a white circular pool 120 cm in diameter, 30 cm deep and filled with 20 cm of white opaque water (SikaLatex liquid, Sika, Norway) kept at 22 ± 1°C. A pneumatically controlled escape platform, 11 cm in diameter, was located at a fixed position halfway between the midpoint of the pool and the wall. During training trials the platform was kept 0.5 cm below the water surface, while during retention trials (probe tests) the escape platform was lowered to the bottom of the pool. The light was kept at approximately 60 lx during testing.
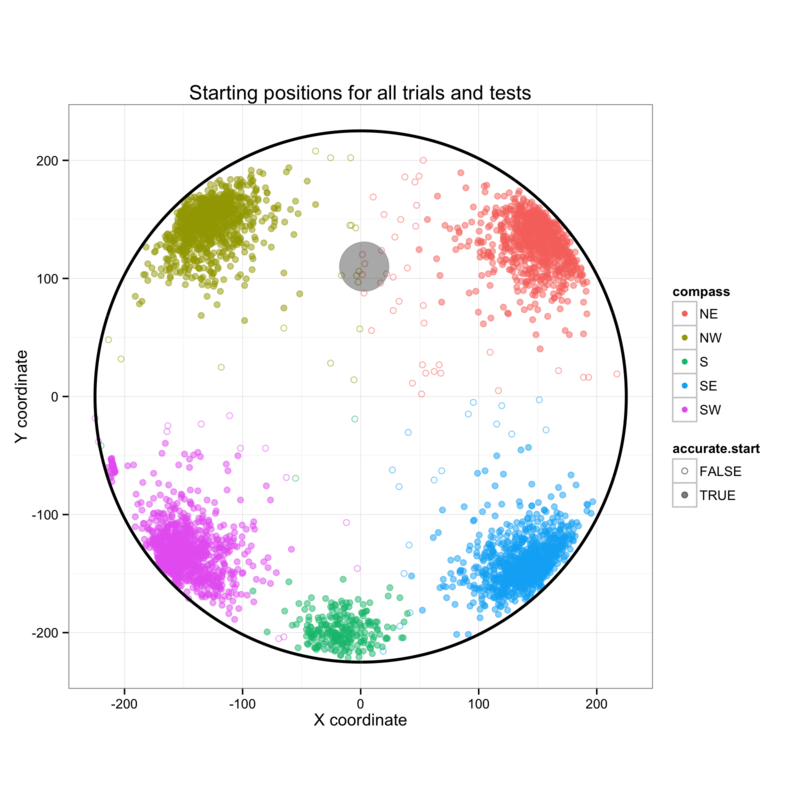
Training trials were conducted in two blocks of four on each of the first four days. There was a 3-4 hr interval between the blocks on each day. The mice were released into the pool facing the wall at one of four fixed positions around the pool wall in a pseudorandom sequence. The mice were given a maximum of 60 s to locate the hidden escape platform. Each mouse performed the four trials in each block consecutively.
Whether or not the mice found the platform, they were guided to, or placed on the platform and allowed to sit there during the inter-trial interval (15 s). A single retention trial was performed for each mouse on days 5 and 12. with link to paper and or bibliographyThe start positions for the blocks on days one to four are shown (NW, NE, SW, SE), alongside the start points for the testing on days five and twelve (S).
2: Paths for a single mouse
Data is most commonly presented as shown in Figure 1A, taking the average latency to platform and using the standard error of the mean as an error bar. This gives apparently clear data, which are then tested for significantly different learning capacity using standard parametric, or occasionally non-parametric methods. (Vorhees & Williams, 2006) Unfortunately this oversimplifies the data in many ways (not least by incorrectly handling the 60 s timepoints where a mouse fails to find the platform) which damage the credibility of the subsequent analysis.


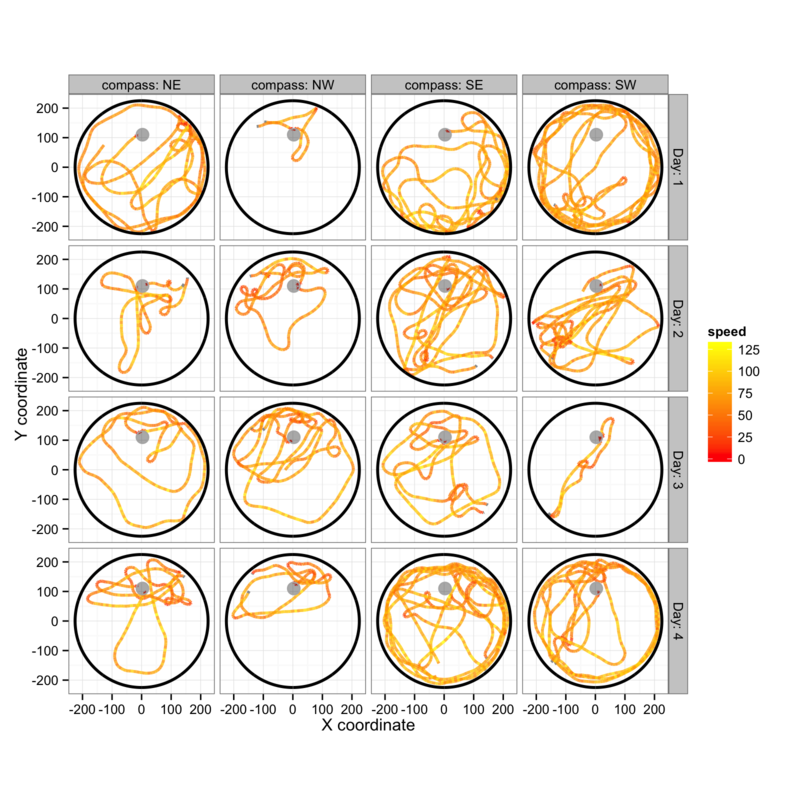
Figure 2: Swimming paths during the 32 training trials for a single mouse show the wide range of swimming patterns and swimming speeds which are observed.
A look at the raw data in figure 1B tells a different story. The tendency towards shorter latencies over time are still evident here, as seen by the decrease in medians with time, but the homoscedasticity and linear learning progression which are necessary for valid parametric tests, can clearly not be assumed.
At this point it is tempting to establish how best to analyse these data, but I will leave that for later and instead address more fundamental questions regarding the latency measure. Although the raw data shown in figure 1B is considerably more detailed than the standard presentation (figure 1A), these times are still an extreme simplification of the spatial data available for each mouse.
The aim here is to investigate the validity of latency as a measure of learning, to determine the heterogeneity of behaviour and learning within a genotype group and to see whether confounding factors can be identified in the spatial data and used to improve the reliability of learning measures.
An example of the spatial data available for each mouse is shown in figure 2A. Paths are grouped by day and starting position, and coloured according to the sequence of 8 trials each day (block 1 trials 1 to 4 then block 2 trials 1 to 4).
It is clear that there is a good deal of variability in swimming speed and search strategies, and there is little in figures 2A-C that can be clearly interpreted as learning behaviour, an observation which fits with the heterogeneity observed in figure 1B.
What is of interest is to see whether there are any consistent trends in the spatial data. Therefore we begin by looking for patterns in large groups of data.
3: Paths for all mice


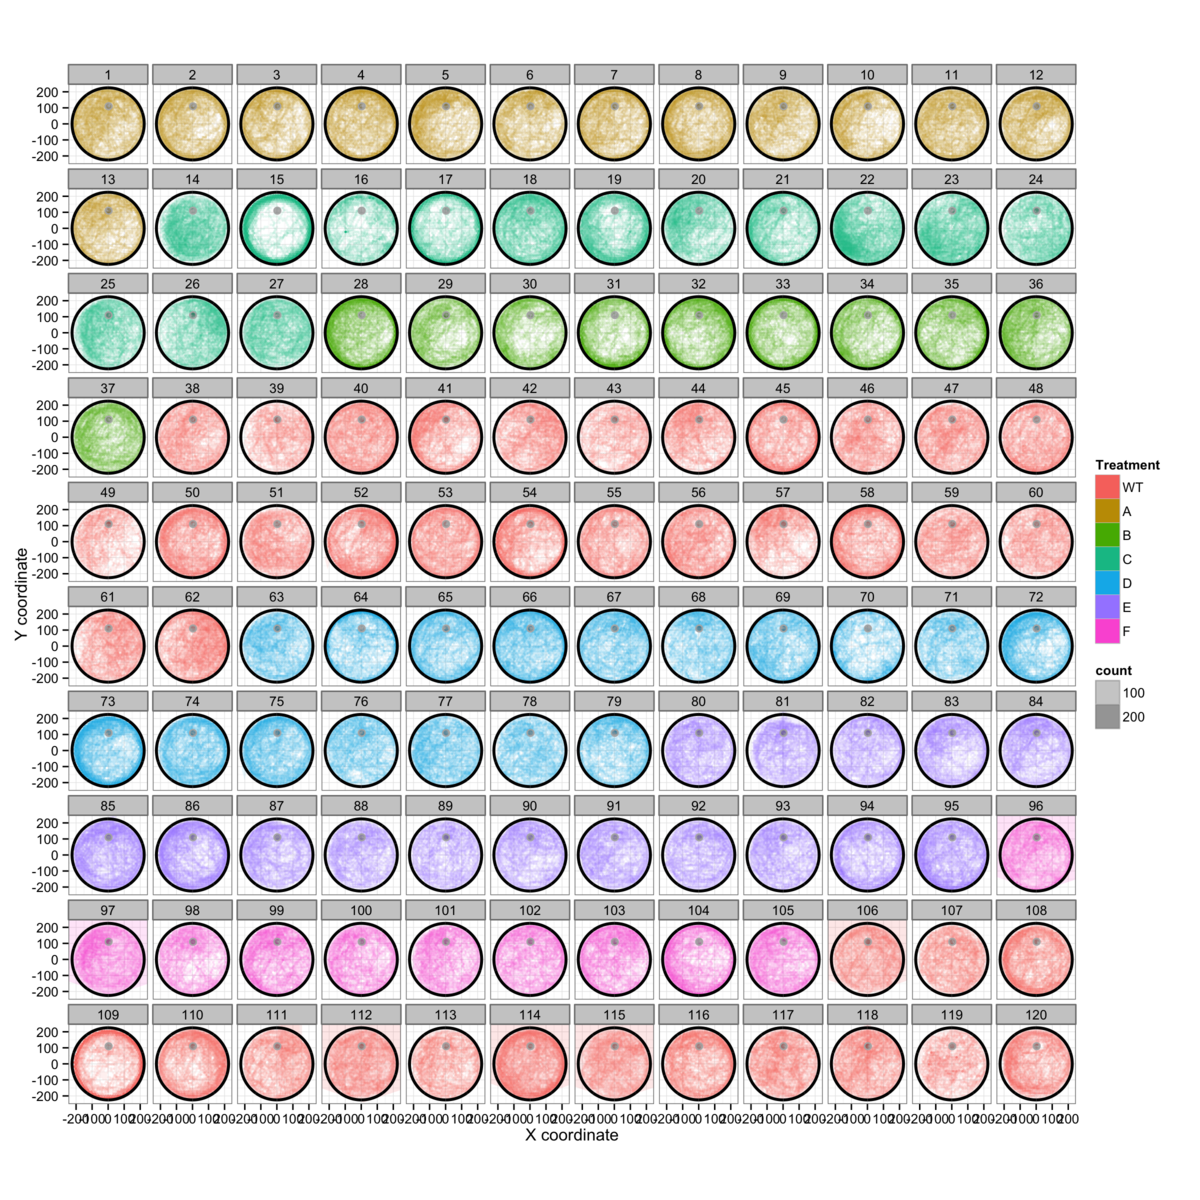
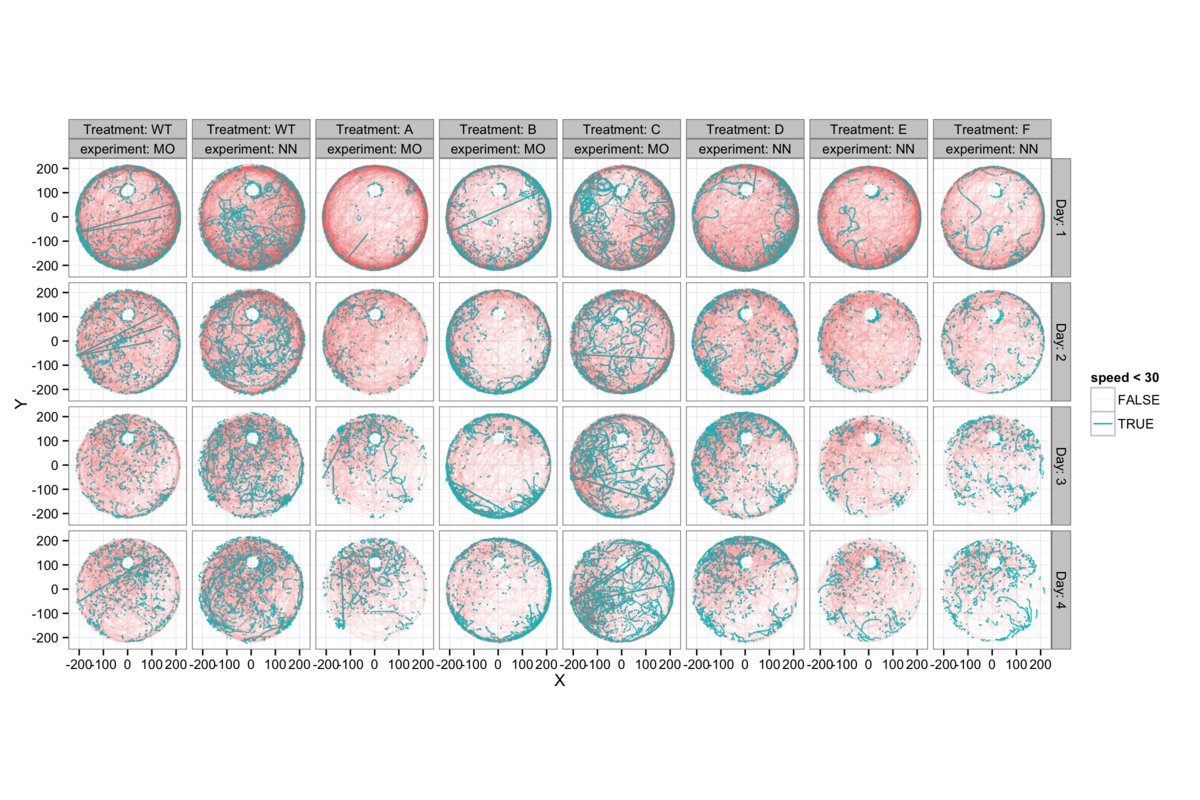
Figure 3: General tendencies while swimming can be seen by aggregating all of the data from each genotype into specific groups for visualization.
The aim here is to investigate the validity of latency as a measure of learning, to determine the heterogeneity of behaviour and learning within a genotype group and to see whether confounding factors can be identified in the spatial data and used to improve the reliability of learning measures.
The compiled data we see in figures 3A&B are very revealing. In spite of what we might expect, there is very little to suggest that the mice establish any sort of "beaten track" towards the target, instead they tend to explore the majority of the pool over time. This is most clearly seen in figure 3D, where the only repetitve traces are those where the mice swim in circles around the edge of the pool. This behaviour is associated strongly with anxiety and therefore biases the measurement of learning.
The same anxiety-like behaviour is also shown in figure 3C, but this time decomposed by genotype and day. This gives a clearer view of the time-dependence of anxiety-like behavour. On day 1 many genotypes show a dark ring around the wall of the pool, while this tends to disappear towards day 4. This implies that the mice become more accustomed to the water maze task over time. We therefore need to examine how much of a role anxiety plays over the 32 trials.
We also see in figure 3E that there is a genotype-dependent tendency to swim slowly in different regions of the pool, though most of the slow-swimming episodes appear to be associated with turning in the vicinity of the pool wall.
4: Swimming speeds near the edge of the pool
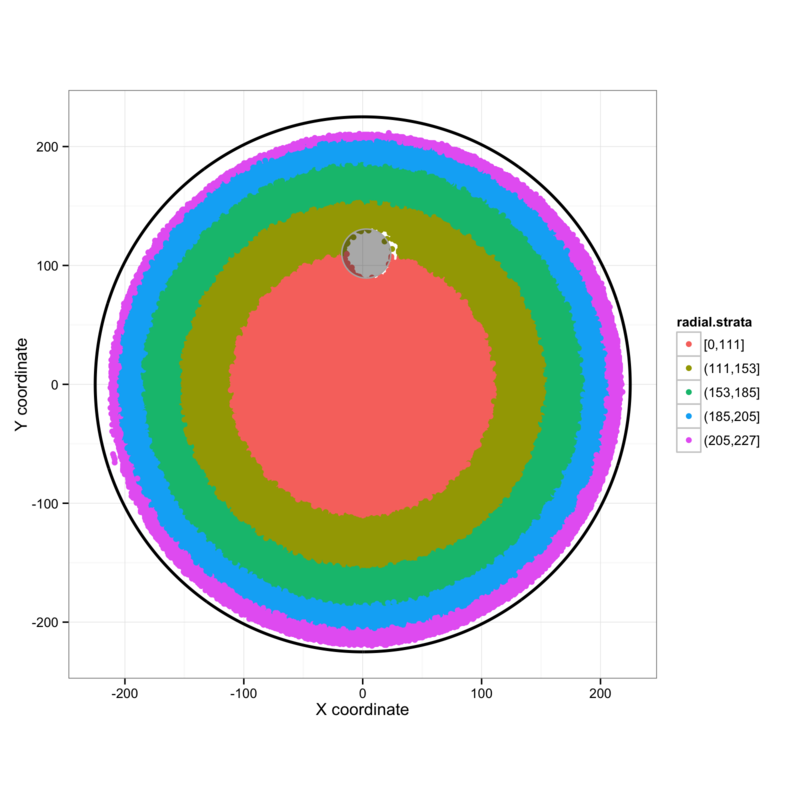

Figure 4: Position in the water maze is divided into radial strata and the swimming speed within these strata is investigated for all genotypes on each day, according to whether or not the mice successfully found the platform.
In order to better appreciate the anxiety-like tendency to hug the wall of the water maze, we can divide the pool into radial strata (figure 4A) and investigate swimming behaviour in each strip. This allows us to separate wall-hugging from swimming in the open area of the pool. Plotting density histograms of the swimming speeds in each of these regions for each genotype and day (figure 4B) shows no great differences in straight-line swimming speeds, but there is a higher incidence of slow swimming (turning) in all pool regions for mice that do not find the platform. I am not clear whether this is an indication of disorientation, anxiety, boredom, or otherwise, but any explanation must take account of the observation that these slow episodes occur more frequently towards the end of the series of 32 training sessions when the mice tend to be least anxious.
Given the inconclusive nature of these results it would be interesting to know what we can usefully take from these data. If we accept the possibility that anxiety-dependent wall-hugging interferes with learning by overriding the urge to find the platform, the latency to platform time becomes a questionable measure of performance. It would be impossible to determine a difference in learning ability between a mouse that swims randomly until it eventually finds the platform after 50 s and a mouse that knows where the platform is but swims anxiously around the pool wall for 45 s before making a 5 s direct dash to the target.
What we can investigate is the proportion of swimming time that each mouse spends close to the pool wall, and examine this for developments during training. We make the assumption, based on the variability seen in figure 2 and the general coverage of the water maze shown in figure 3, that the intervals between training sessions are relatively insignificant and that we can use the trial number as a measure of experience in the maze.
5: Anxiety and adaptation to the water maze
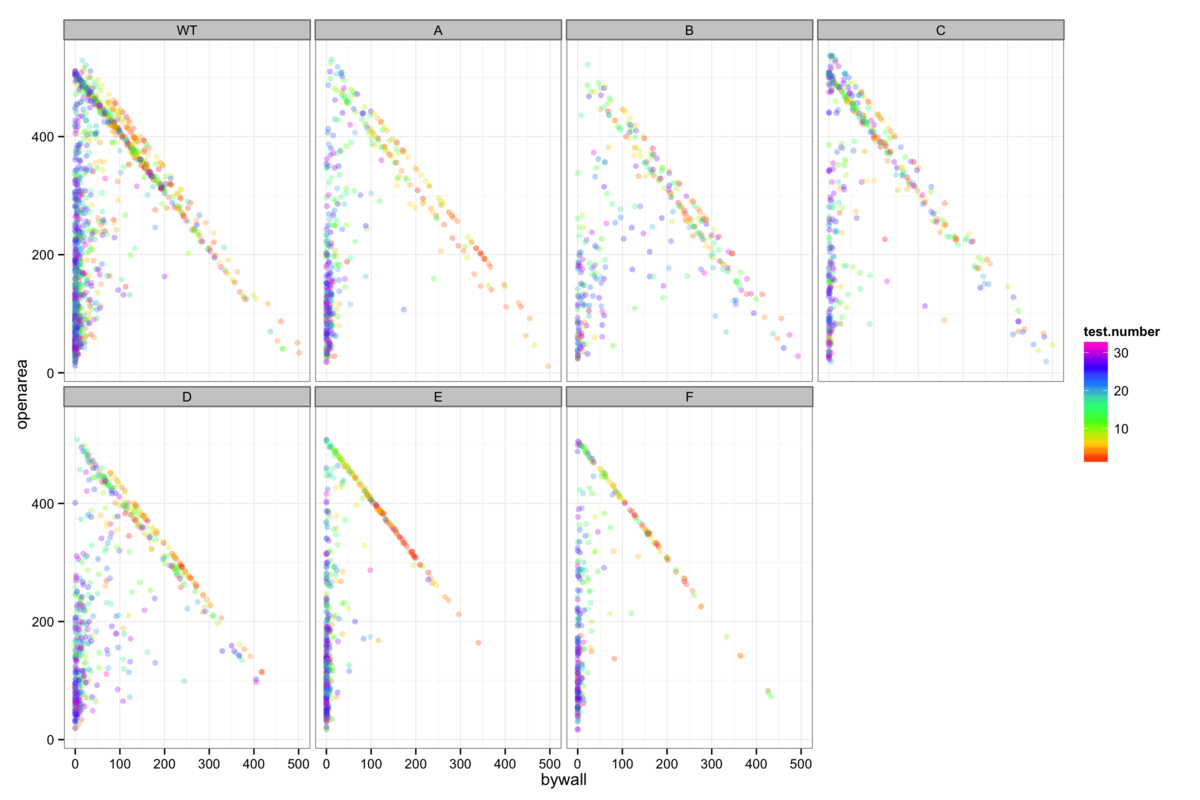
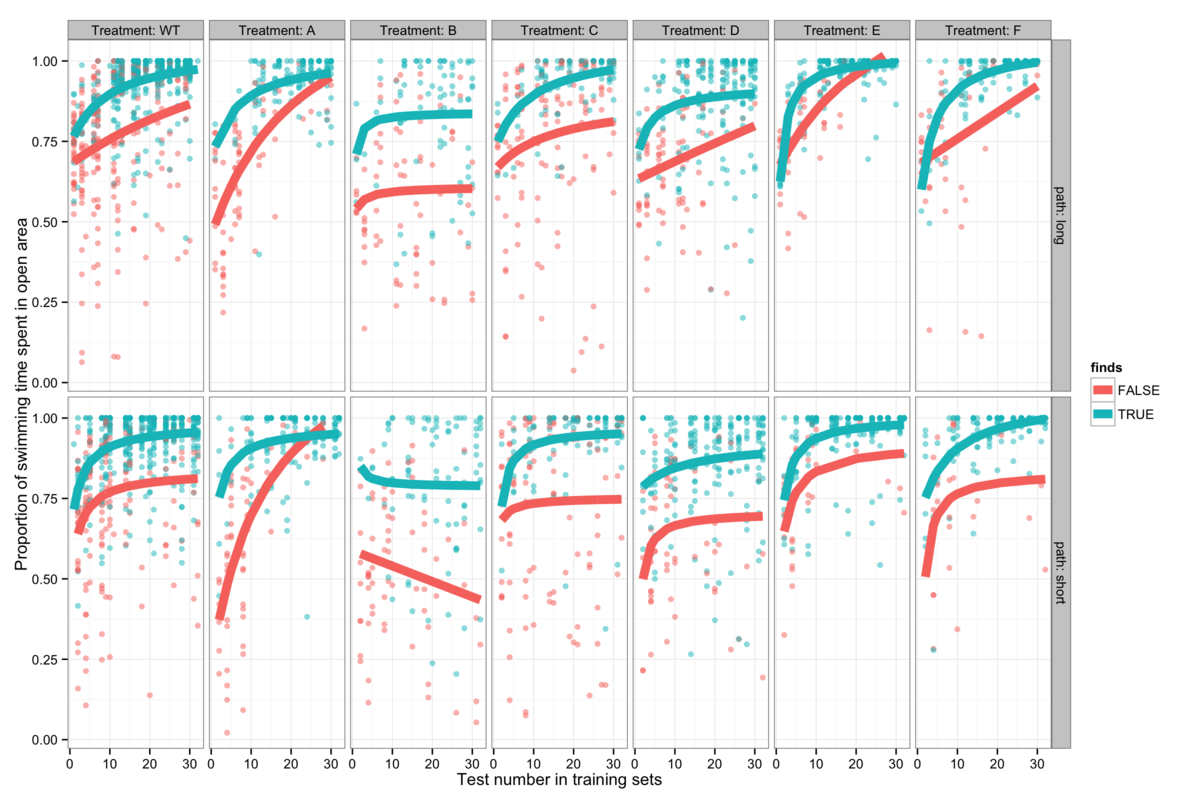
Figure 5: The proportion of swimming time spent in the open area of the maze as opposed to wall-hugging (a measure of anxiety), is dependent upon experience and genotype. Mice which do not find the platform can be clearly seen to spend more time wall hugging, implying that anxiety is key to whether or not mice find the platform.
In order to better understand the role of anxiety in the water maze, it is instructive to examine the regions of the pool preferred by mice and the effect of experience gained by repeated trials. A simple presentation of this is given in figure 5A, where data points are classified as wall-hugging or open area and the number of points in each region for each trial are plotted against eachother. Colouring by trial number clearly shows that early trials tend to occupy a diagonal line (meaning that the platform is not found) while later trials spend less time by the wall. This is of course somewhat genotype-dependent and implies a varying increase in confidence with experience in the maze.
| Genotype | path | Max conf | Mean conf | Median conf |
|---|---|---|---|---|
| E | long | 0.99 | 0.94 | 0.98 |
| F | long | 1.00 | 0.91 | 0.95 |
| WT | long | 0.97 | 0.91 | 0.94 |
| C | long | 0.97 | 0.91 | 0.93 |
| A | long | 0.96 | 0.91 | 0.93 |
| D | long | 0.90 | 0.86 | 0.88 |
| B | long | 0.84 | 0.82 | 0.83 |
Table 1: Genotypes ranked by the mean confidence of the Michaelis-Menten fits in figure 5B for all mice that find the platform. This ranking correlates reasonably with a typical measure of learning as shown in figure 1. These rankings are very similar for the short path.
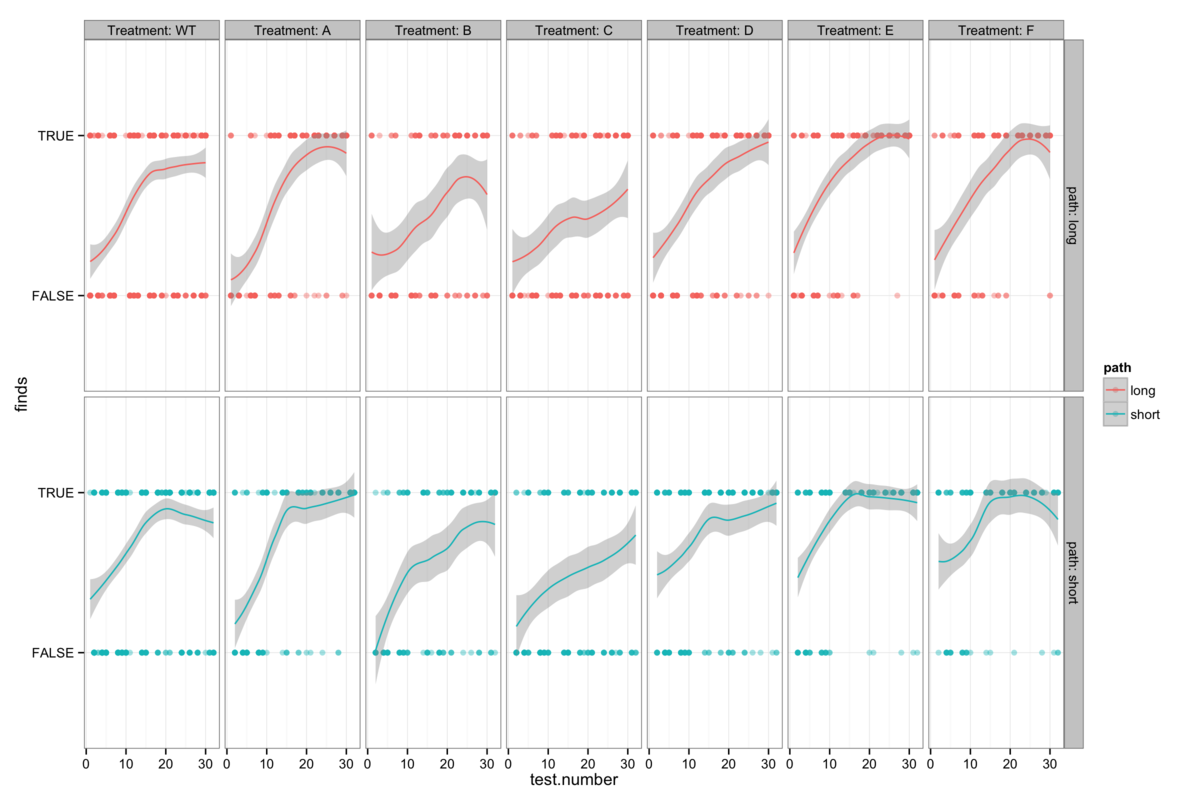
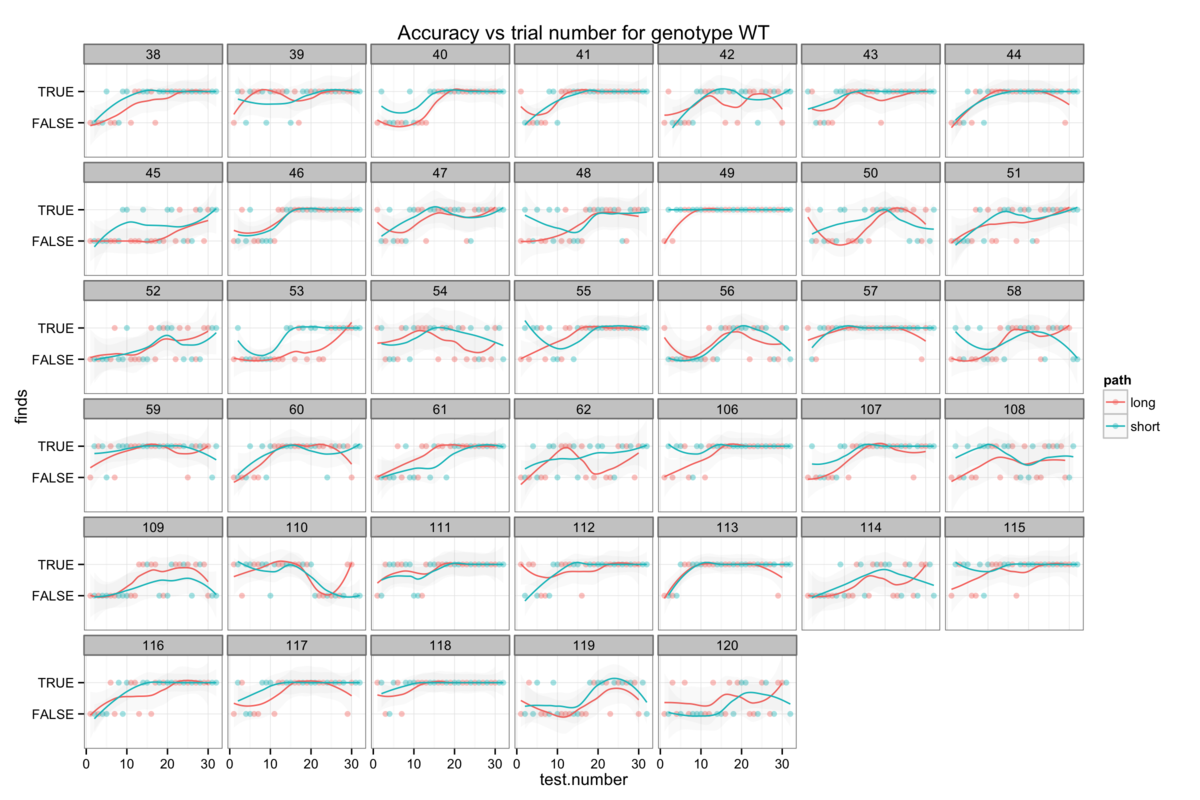
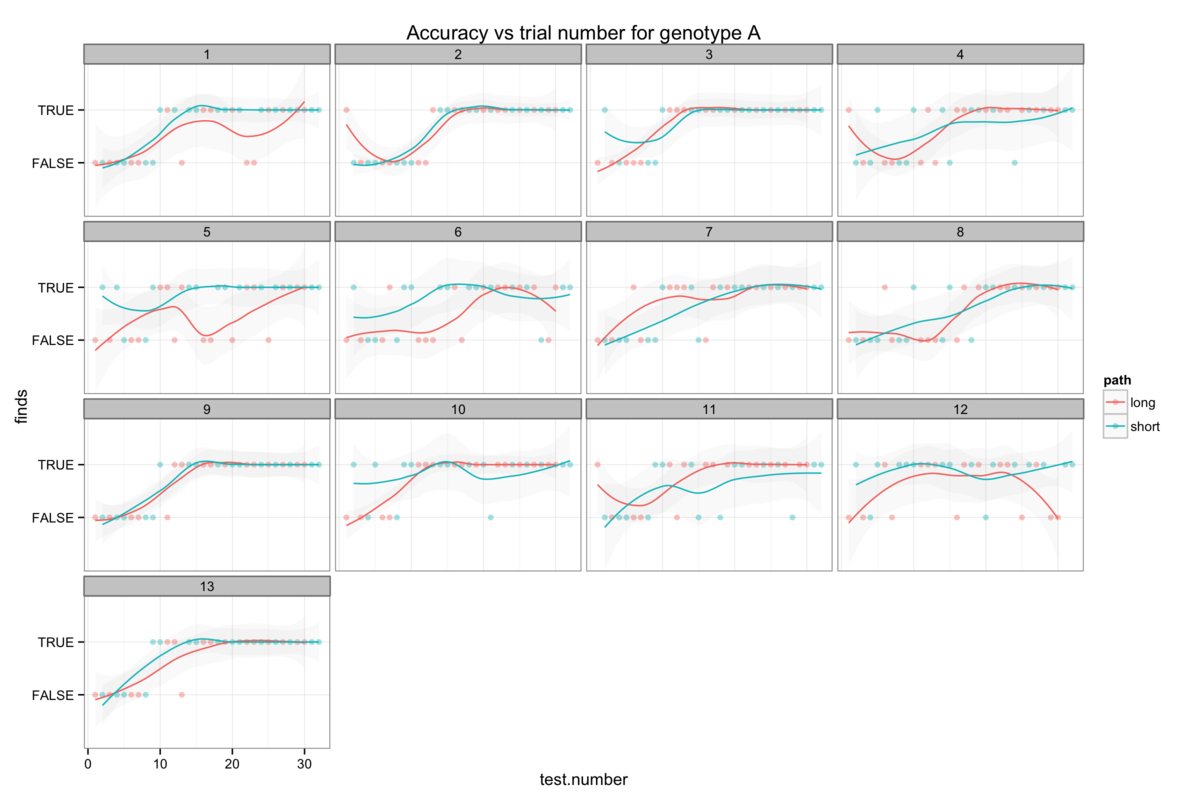
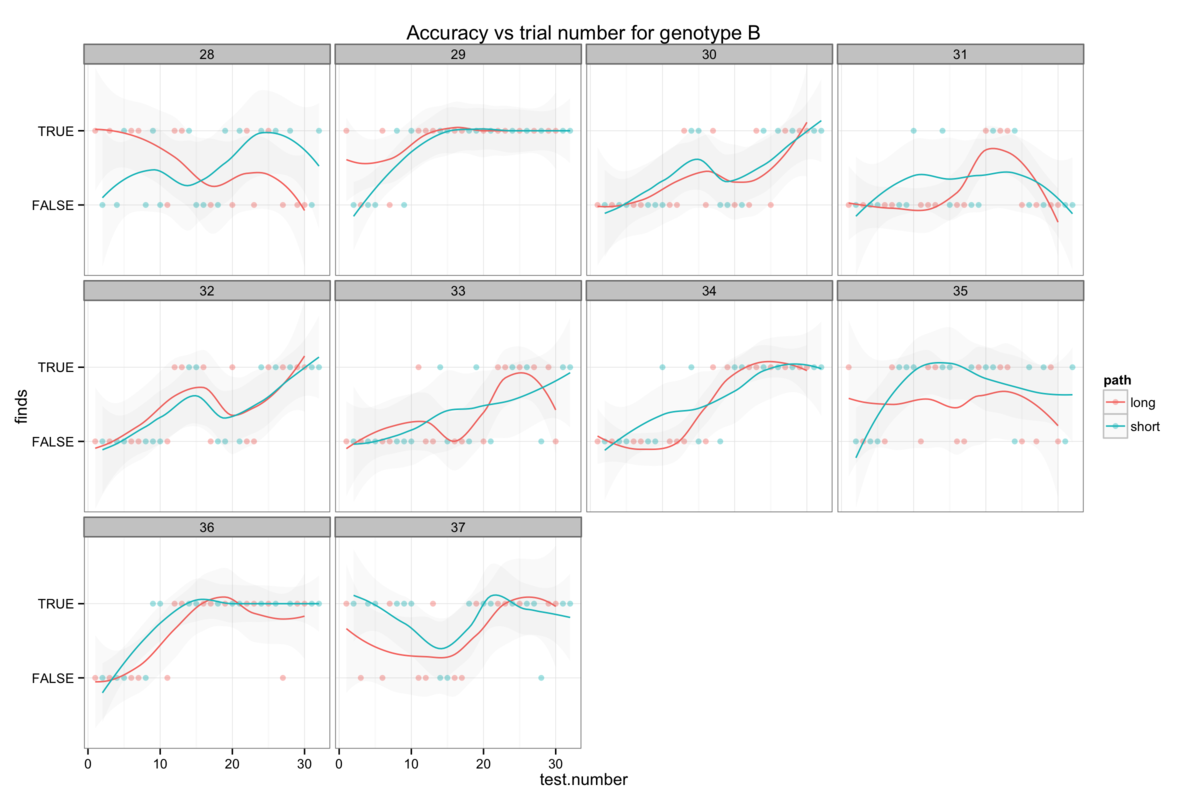


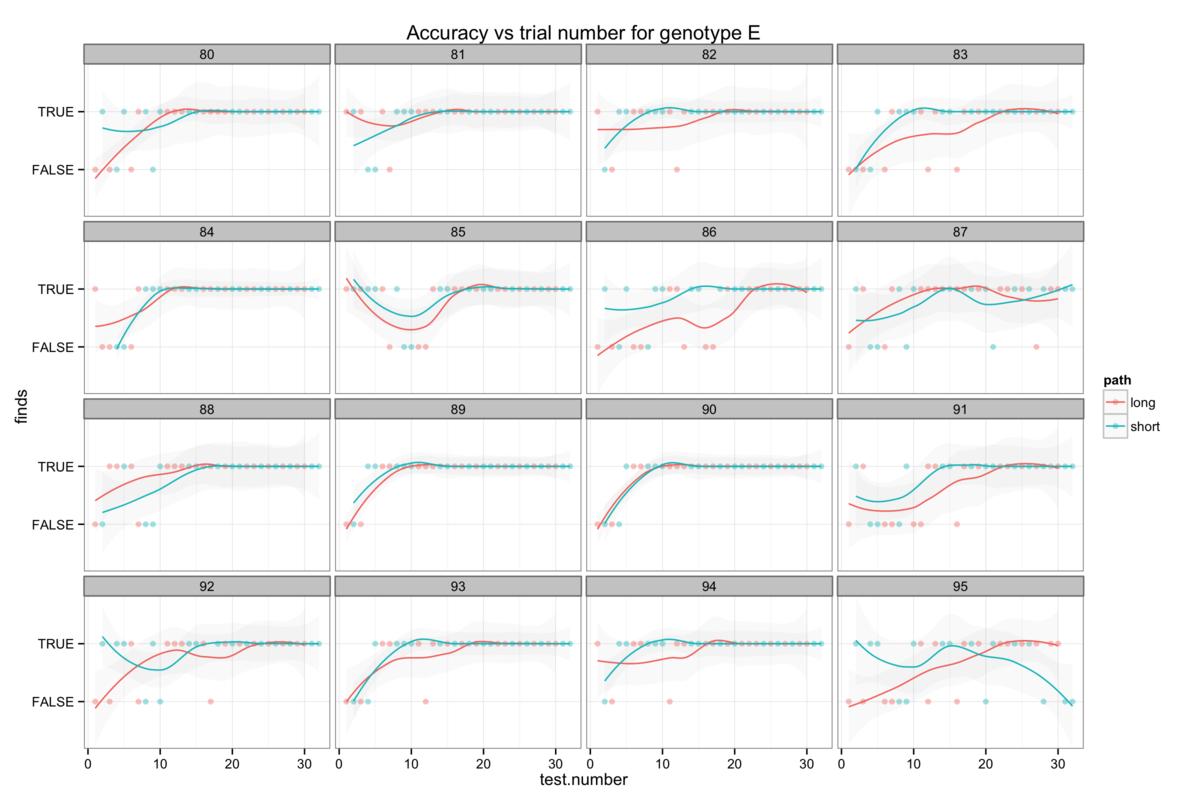
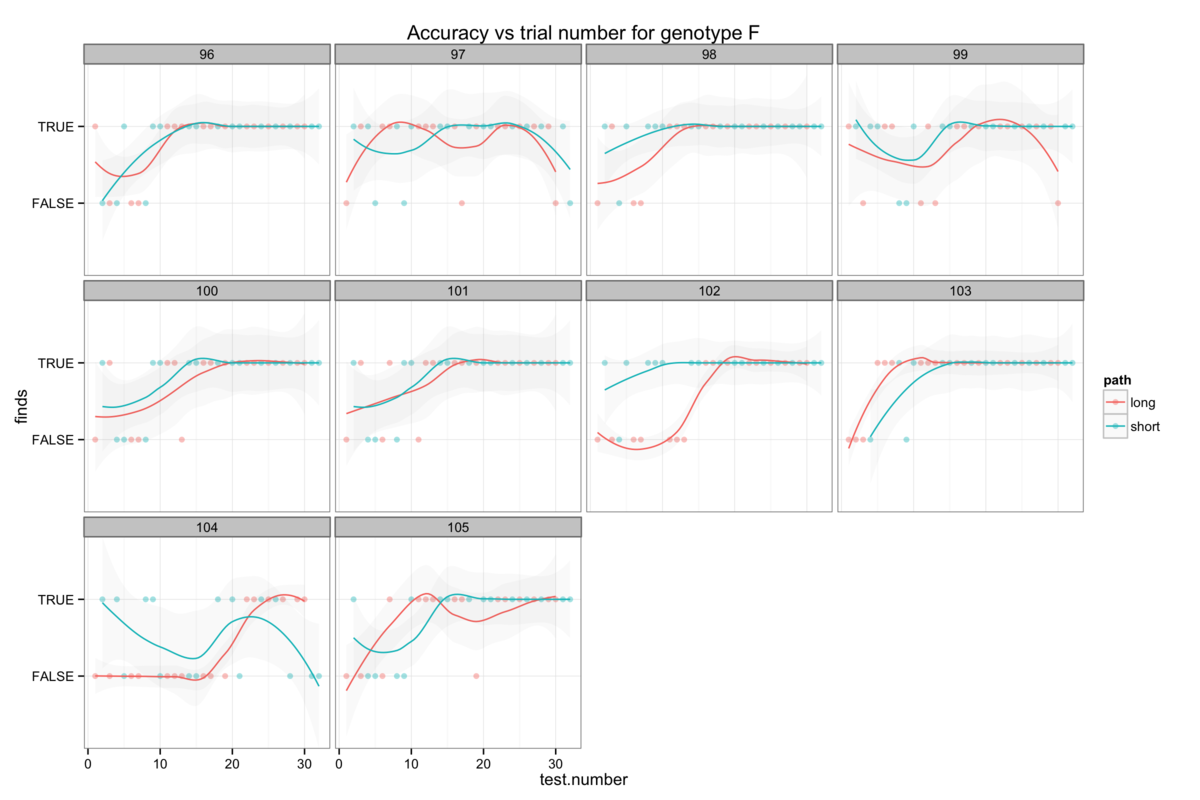
Figure 6: The genotype-specific dependence of platform finding success (accuracy) upon experience. Successful trials are marked TRUE and failed trials FALSE. The smoothing line gives a measure of the percentage success rate after a given number of trials.
It is also informative to see the proportion of swimming time that is spent in the open area, since the mice generally tend to find the platform regularly after several trials. I have interpreted an increasing tendency to explore the open area of the pool as increasing confidence due to familiarization with the environment. This is presented in figure 5B with a Michaelis-Menten curve (or a linear model in the few cases where the data is extremely noisy) showing confidence as a function of trial number fitted for each genotype to both the mice that find the platform and to those that do not. Further insight into the relative randomness of the open area exploration is shown by grouping trials according to the distance from the start to the platform - short starting at NW or NE and long starting at SW or SE - and seeing little to distinguish between them. It is abundantly clear that mice of all genotypes that do not find the platform have a lower level of confidence than those that do, implying that confidence is fundamental to how successfully these mice find the platform.
Instead of demonstrating a less accurate platform search strategy which could indicate poorer learning, mice that do not find the platform show a consistent anxiety-like preference for avoiding the open area of the pool where the platform lies.
We can also also illustrate this correlation between confidence and apparent learning by looking at how experience affects the success rate (I will call this accuracy here for want of a better word) with which mice find the platform. Figure 6 also shows that the genotypes with the highest confidence levels also tend to be those with the highest accuracy.
Attempts to establish significant differences between genotypes are additionally hamstrung by some level of heterogeneity in the behaviour of mice within a genotype group. Figures 6B-H show the accuracy of individual mice and at times illustrate dramatically differing success rates. Taking figure 6E, we see that mouse number 15 never finds the platform (Examining figure 3D shows us that this mouse resolutely swims around the wall of the pool) while mouse 24 rapidly becomes reliably accurate. Without knowing the root cause of this behaviour it is difficult to decide whether this mouse counts as an outlier, but that would require us to understand what a mouse is thinking and that way madness lies.
In short, there seems to be sufficient evidence to doubt that the latency to platform measure in the Morris water maze can reliably be used to measure learning ability in mice.
6: Navigation in the water maze
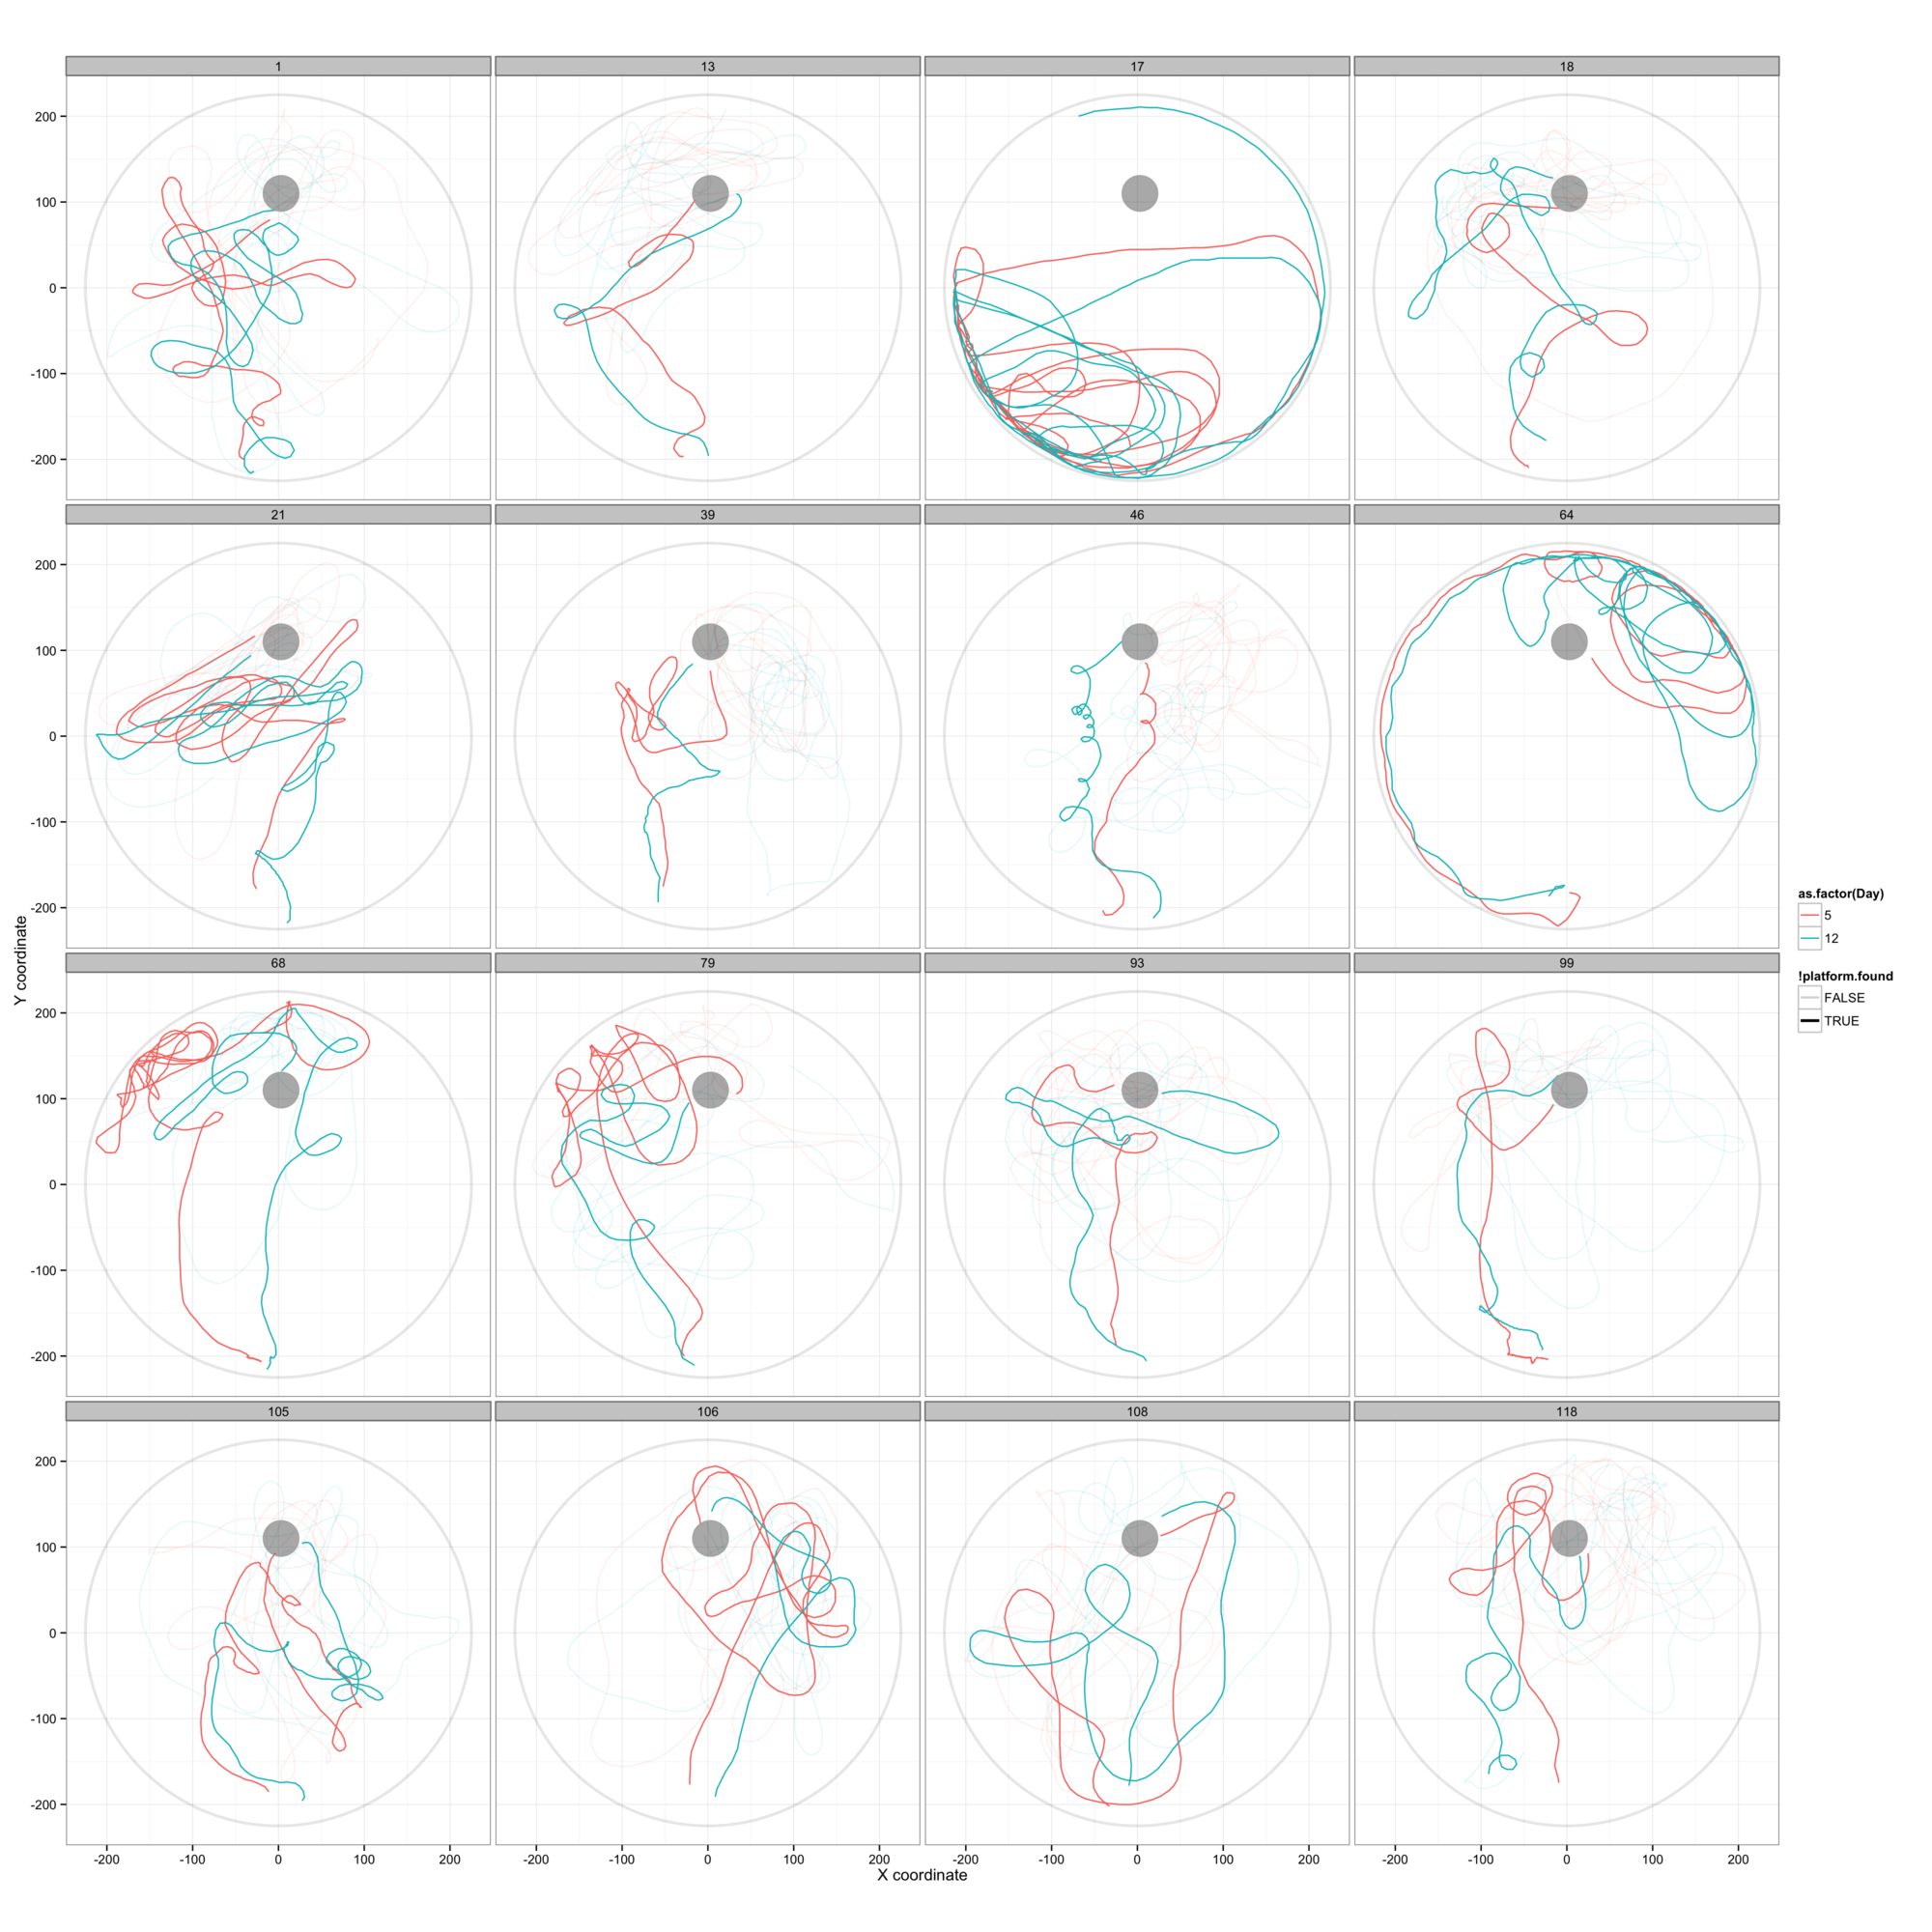
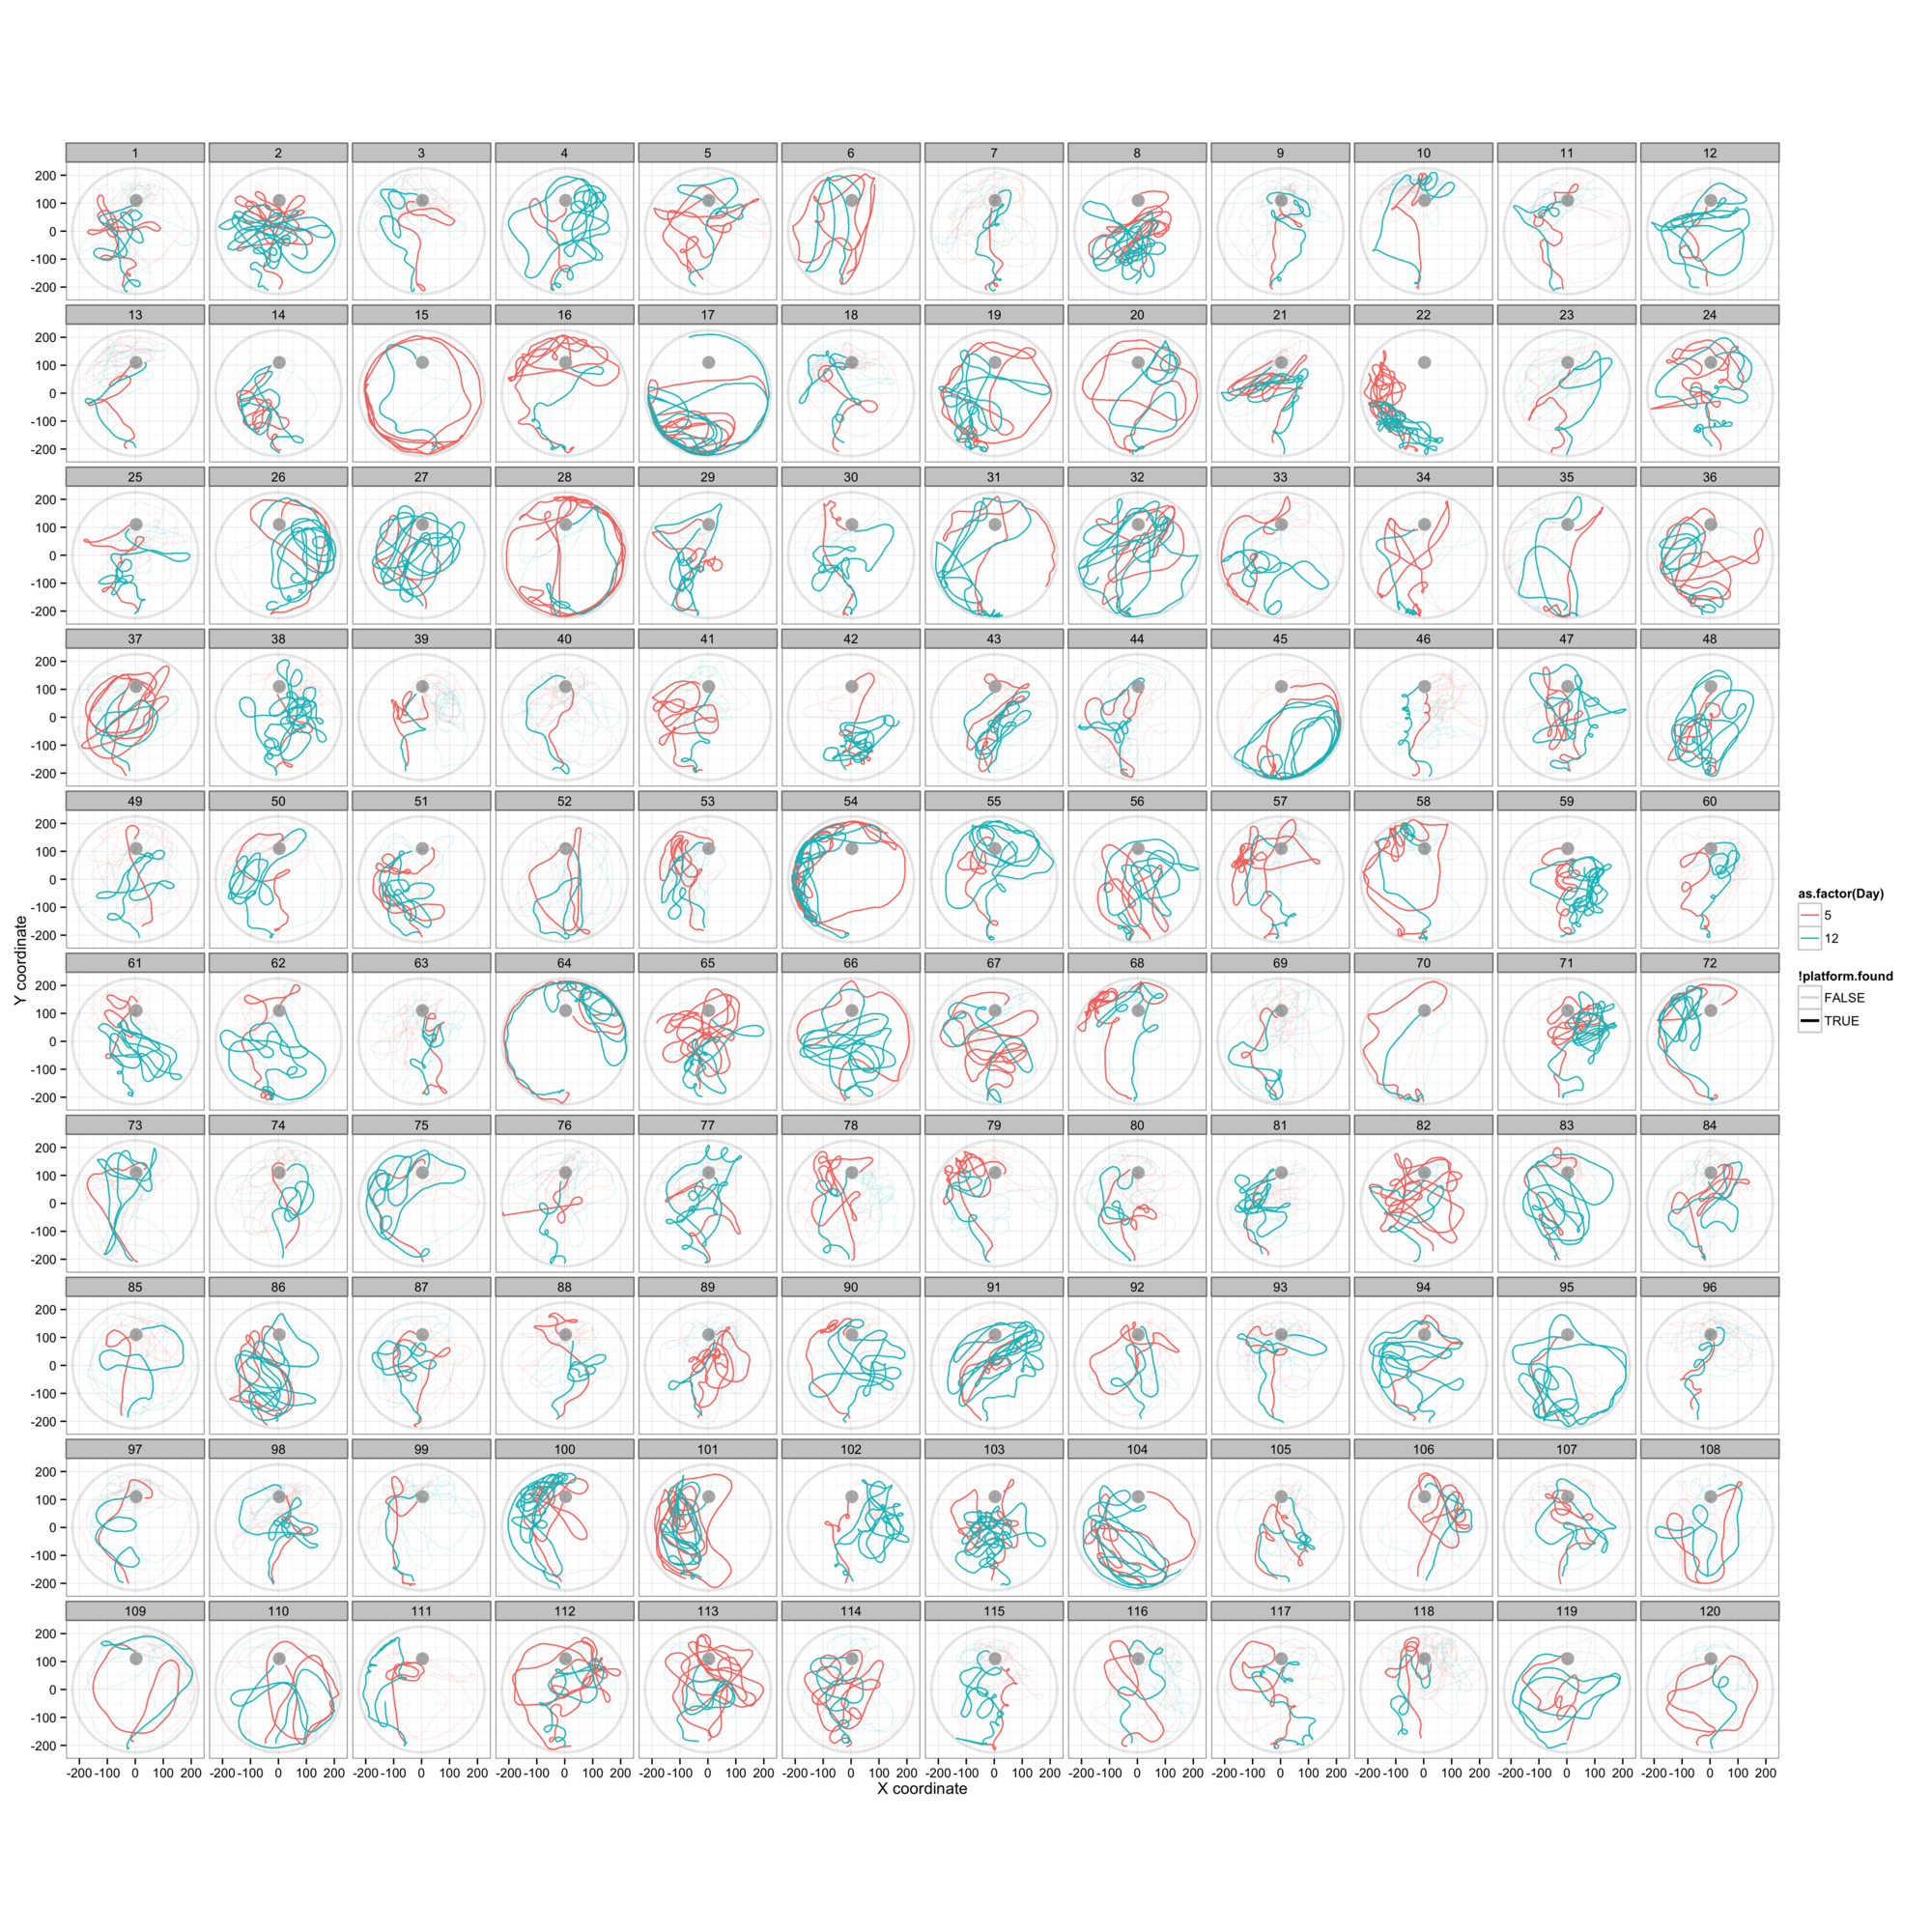

Figure 7: On day 5 the mice are released from a point due S of the platform and allowed to swim freely. The platform has been lowered so that the mice no longer find it, but entry into the platform region is recorded. The mice have no contact with the water maze for a week and are then released from the same point on day 12, to repeat the process. There is a surprising similarity between the paths chosen by individual mice on days 5 and 12, suggesting that they have a very detailed recollection of the path swum a week previously.
In addition to the training process on the first four days, a memory retention experiment is performed on days 5 and 12. The platform is lowered to the bottom of the pool and the mice are released once from a new point due south on the pool, furthest from the platform location. They are allowed to swim for 60 s and the time at which they first enter the area (if at all) where the platform previously was is recorded. They then spend a week without contact with the water maze before being released once again from the same point on day 12.
Looking at the overlay of day 5 and day 12 swimming paths for individual mice yields some striking impressions, exemplified in figure 7A, but shown in full detail in figures 7B and 7C. In figure 7A we see 16 examples of these paths, none of which follow a particularly direct route to the platform area. What is evident here is both a quantitative (positionally tending to move through a very similar area) and a qualitative (turning in the same direction in approximately the same location, exploring specific regions, following the wall to a similar location) similarity im the paths swum. I would be extremely surprised if this were random (although these are the best examples and some of the 120 mice show no similarity - figure 7B) and it may in fact reveal an unexpectedly rich and long-lasting spatial recollection formed by a single previous experience.
Given this, it appears not to be fair to judge memory retention by the difference in time taken to swim to the platform on days 5 and 12, since there is no relation between memory and the directness of the path to the platform. However the similarity of these tracks in unnatural circumstances where these mice closely replicate a relatively complex path in the simplest possible landscape, rather than triangulating on the visual cues and using them to navigate directly to the platform location is particularly interesting.
It appears that many of the mice attempt to follow the path they swam a week earlier, even if it is an extremely inefficient route to the platform. While this would be easy to perform in a complex landscape with physical barriers and many visual cues, swimming a repeat of a complex path one week later seems like a much harder navigational task (in human terms) than any other approach. This suggests that a mouse's spatial memory differs from human spatial memory and may be more dynamically visual, perhaps allowing the mouse to retrace its tracks in space as though it were constantly able to compare its position with a video record of its previous path. We can also speculate as to whether this behaviour is a stress-related strategy, whereby a known path to safety (they are conditioned to expect rescue after a maximum of 60 s) is chosen automatically in a panic, in preference to any rational attempt to navigate.
Perhaps this is evidence of important navigational abilities in mice under stress, and could possibly be compared to a human navigational behaviour (escape/flight response) under stress.
Conclusions
Results from the Morris water maze should be interpreted with caution, since anxiety may override learning in a way that cannot easily be controlled for.
Do established methods exist for comparing the similarity between paths which could be meaningfully applied here? I have a method in mind to compare paths in space (without depending upon temporal synchronicity), but am assuming that others have done this before me. I would be appreciative of any guidance here.
The change in the times taken to enter the platform area on days 5 and 12 may not fairly represent memory retention in mice.
There is evidence of extremely precise long lasting spatial memory formed by a single event in the similarity between swimming paths on days 5 and 12.
Other observations
There appears to be a periodicity of 4 trials superposed on what would otherwise be a decaying continuum. While it may be coincidental, the preiodicity of 4 is notable, since trials are performed in blocks of 4 in the morning and in the afternoon on each day. Given this, we could read this as an indication that a failure to find the platform early in the block of four trials biases against finding the platform in the latter trials of the same block. If the mice have a tendency to return to "familiar territory" in the pool, then those that find the platform early will tend to go back to the platform area, while those that occupy themselves elsewhere in the pool will also tend to return there, reducing the chance of them finding the platform. It would be interesting to see whether this is a trait that is observed in other data sets, or whethre it is coincidental.

Other.
References
- Alexander Garthe, Joachim Behr, Gerd Kempermann, Ryan L. Earley, (2009) Adult-Generated Hippocampal Neurons Allow The Flexible Use of Spatially Precise Learning Strategies. Plos One 4 e5464-NA 10.1371/journal.pone.0005464
- A. Garthe, Z. Huang, L. Kaczmarek, R. K. Filipkowski, G. Kempermann, (2014) Not All Water Mazes Are Created Equal: Cyclin d2 Knockout Mice With Constitutively Suppressed Adult Hippocampal Neurogenesis do Show Specific Spatial Learning Deficits. Genes, Brain And Behavior 13 357-364 10.1111/gbb.12130
- Charles V Vorhees, Michael T Williams, (2006) Morris Water Maze: Procedures For Assessing Spatial And Related Forms of Learning And Memory. Nature Protocols 1 848-858 10.1038/nprot.2006.116
Published 14 May 2014
© 2014 Alexander D. Rowe, · Oslo University Hospital - Rikshospitalet ·
 This work is licensed under a Creative Commons Attribution-NonCommercial-ShareAlike 3.0 Unported License.